
Excel databases: Creating relational tables
 Image: Rob Schultz
Excel possesses formidable database powers. Creating a relational database starts with a Master table that links it to subordinates, called (awkwardly) Slave, Child, or Detail tables.
Before we dive in, we’ve provided you with a sample workbook you can use to follow along with our how-to and practice each step. Just click the arrow or link below to start the download.
download Workbook for Relational Databases, Reports, and Pivot TablesThis is a workbook with multiple spreadsheets whose content can be used to practice Excel tasks in relational databases, reports, and pivot tables. JD Sartain
How relational databases work
Excel’s organizational structure lends itself well to how databases work. A database is a collection of connected items (spreadsheet) that, when associated, creates a single record (row) inside a group of multiple records (table).
One spreadsheet, alone, is a database, but not a relational one. The relational database is a combination of the Master spreadsheet table and all of its Slave tables or spreadsheets.
Office Home and Business 2016
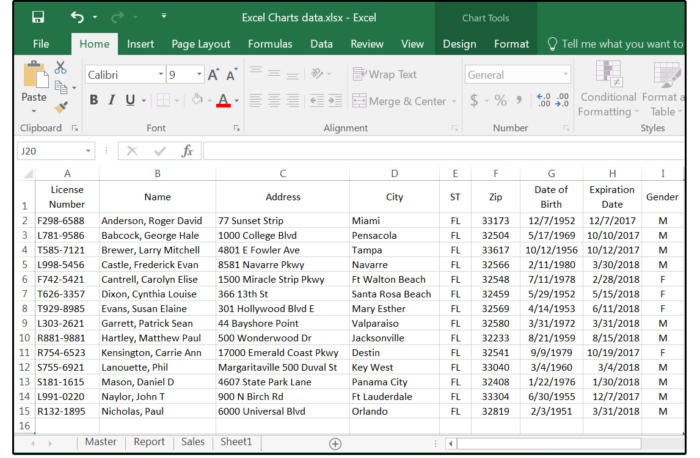
For example, your driver’s license is a single record in a flat-file database that resides on a computer at the Department of Motor Vehicles (DMV). Your license contains your name, gender, height, weight, eyes and hair color, address, date of birth, license issue and expiration date, license class.
Because it’s possible to have multiple people with the same name, address, gender, and description (like a father and son), driver’s licenses all have license numbers. This unique number is called a Key Field, which is used to connect a flat-file database to other associated databases (called relational databases).
 JD Sartain / PC World
A basic flat-file spreadsheet database
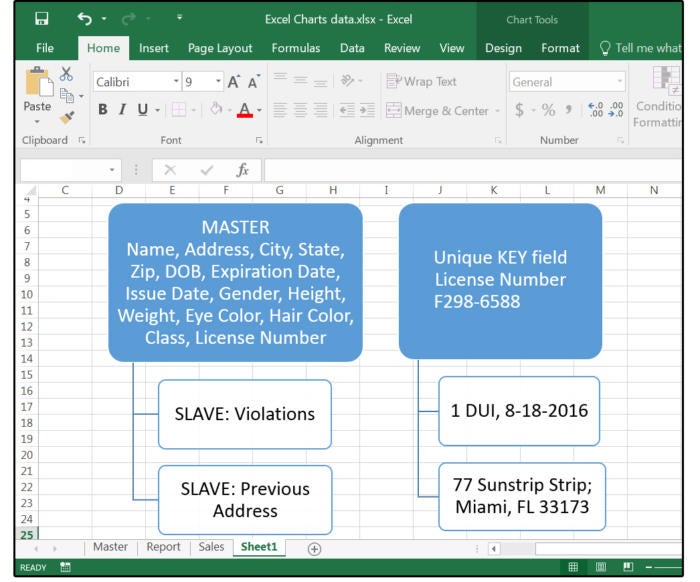
This foundational Master database (in this example) contains all the information that’s on your driver’s license. One or more related databases, called Slave, Child, or Detail databases, contain additional information that’s related to the individual drivers (identified by the unique key field License Number). For example, one Slave database might contain all of the individual’s driving violations, while another might contain all the previous addresses of the individual drivers. This type of relational database is called a One-to-Many relationship, which means each driver can have multiple violations or multiple addresses, but the violations and/or addresses databases cannot have multiple drivers.
Other types of relationships include One-to-One and Many-to-Many. In a Sales database where customers purchase products, some customers might receive special discount rates (such as wholesale, retail, tax exempt, etc.), which would require a Discount Rate database. That would be a one-to-one relationship with the Customer database. When a customer can purchase many products and the same product can be purchased by many customers, you have a many-to-many relationship.
 JD Sartain / PC World
Relational Database Master and Slaves
Who needs a relational database
There are many reasons to create relational databases. The most obvious is so you don’t repeat the same data on every spreadsheet in your workbook. For example, it’s redundant, time-consuming, and resource-intensive to retype all the driver’s names and birth dates from the Master database to the multiple Slave databases. And even if you copy the information from one to the other, it still uses unnecessary disk space and memory, which slows everything down. Also, the name and birthdate are not really unique. For example, there are likely hundreds of Jack Taylors and John Smiths, and some of these could easily have the same birthdate. But if you just use the License Number, you can’t identify the drivers, so you’re forced (to be safe) to use all three fields (at least).
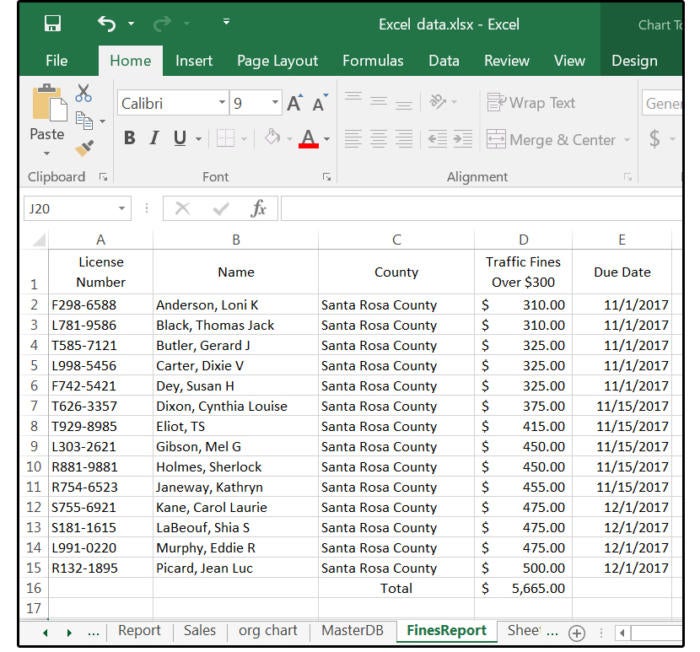
The most essential reason for relational databases is to create queries and filters that can extract specific information and print reports. Say your boss wants a report that shows everyone in Santa Rosa County, Florida with traffic fines in excess of $300; or how many drivers in Pensacola have license renewal dates in December? Without the relational database capacity, you would have to cut and paste this information together from three or more spreadsheets onto a fourth spreadsheet, then hope—when you’re all finished—your boss doesn’t announce, “I said Sarasota County, not Santa Rosa County.”
 JD Sartain / PC World
Relational database reports–traffic fines
Further Excel training
If you want to deepen your Excel mastery, a number of online courses exist to expand your knowledge. Here are our top picks to start with:
Coursera – Excel Skills for Business: Essentials
EDX – Analyzing and Visualizing Data with Excel
Lynda.com – Excel: Scenario Planning and Analysis
Udacity – Excel Fundamentals
Create a relational database
Let’s create a relational database with several separate tables or spreadsheets.
Creating the Master Table
1. Use the same fields shown in the first screenshot above (“A basic flat-file spreadsheet database”), and then fill in 12-15 records with your own data (or use ours). Those fields are: License Number, Name, Address, City, State, Zip, Date of Birth, Expiration Date, and Gender.
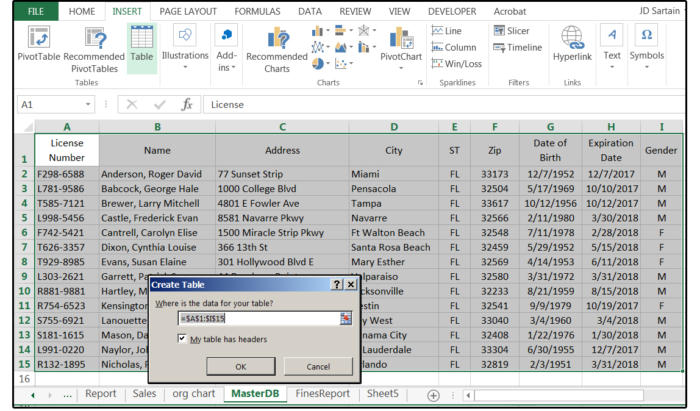
2. When finished, highlight the entire table including the headers; that is A1 through I15 (A1:I15). Remember that CTRL+A highlights the entire table in one stroke, as long as your cursor is positioned somewhere/anywhere inside the table range.
3. Select the tab and button: Insert > Table
4. If the range is highlighted (which it should be), the range address appears in the field called: Where is the data for your table in the Create Table dialog box. Check the box that says: My Table Has Headers, then click OK.
 JD Sartain / PC World
Create/Insert the Master Table
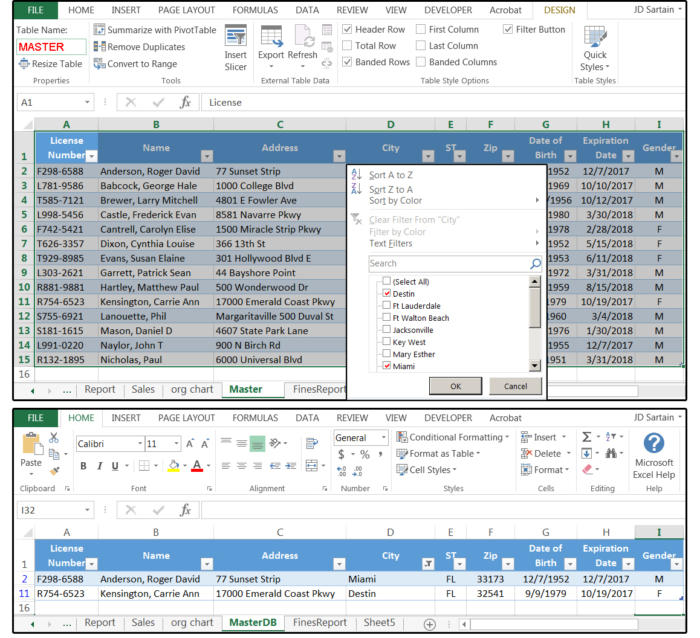
5. As soon as that dialog window closes, BE SURE to name your table in the Table Name field box (top left corner) in the Properties group (on the current screen). Type MASTER, then press the Return key.
6. Notice the table now shows down arrows beside each field name. Click one of the down arrows (e.g., City) and notice the dialog menu box that appears. This box contains Sort options that include filters, which allow you to display specific information based on the selected filter. For example, if you uncheck the Select All field box, and then check only the field boxes that say Miami and Destin, Excel filters OUT all cities EXCEPT Miami and Destin.
NOTE: Don’t panic when all the remaining records disappear. They are not gone, just hidden. To view them again, click the down arrow beside the field City, then click the All button, and they’re visible again immediately.
TIP: Click the Text Filters option on the Filters dropdown menu to select filtering options from the popup list (as opposed to just matching fields from the Checkbox List). Options include Equals, Does Not Equal, Begins With, Ends With, Contains, Does Not Contain, Custom Filter.
7. Remember to change the tab (that says Sheet1) at the bottom of the spreadsheet to say Master. Double-click the spreadsheet tab to change the name quickly.
 JD Sartain / PC World
Use filters to extract specific data from your spreadsheet table
Slave Tables
1. Next, create the Slave Tables. Press the + (plus sign) on the Navigation bar to add two additional spreadsheets. Name one of these Violations and the other Addresses.
2. Copy column A (License Numbers) to column A in both of the other spreadsheets. Adjust the column widths to 11.
NOTE: Remember, the Slave table in this example is a one-to-many, which means there are multiple records per driver, so the Key field (License Number) can—and will—be repeated many times. We are copying it to the Slave tables so you don’t have to re-enter the data. For each multiple entry, just recopy the License Number before you enter the data in the rest of each record.
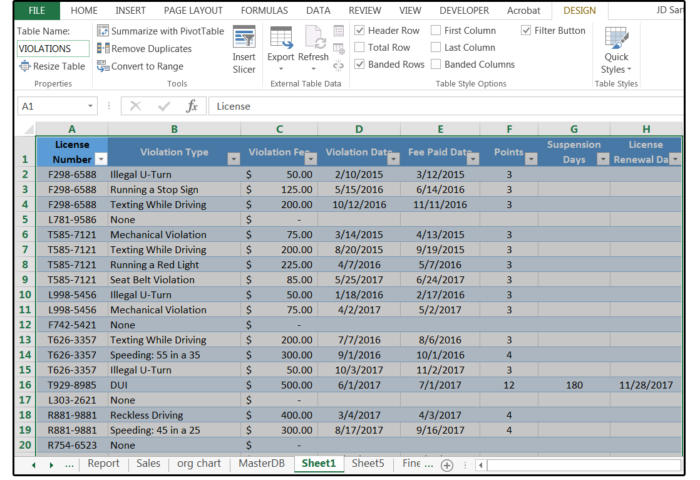
3. Use the same fields shown in the following screenshot “Relational database: Violations Slave Table” below, and then fill in your own data (or use ours). Those fields are: License Number (in column A, of course), Violation Type, Violation Fee, Violation Date, Expiration Date, Fee Paid Date
4. Enter around 30 records with repeated License Numbers. For example: License number F298-6588 is repeated three times. This means Roger Anderson (the driver with this license number) has three driver’s violations.
5. When finished, highlight the entire table including the headers: A1:H31.
6. Select Insert > Table
7. The range address appears in the field called:Where is the data for your table in the Create Table dialog box. Check the box that says: My Table Has Headers, then click OK.
8. As soon as that dialog window closes, BE SURE to name your table in the Table Name field box (top left corner) in the Properties group (on the current screen). Type VIOLATIONS, then press the Return key.
9. Click one of the down arrows beside one of the columns/fields. Notice the dialog menu box that appears. Experiment with the Sorting and Filters to view different results from this table.
 JD Sartain / PC World
Create the Violations Slave Table spreadsheet
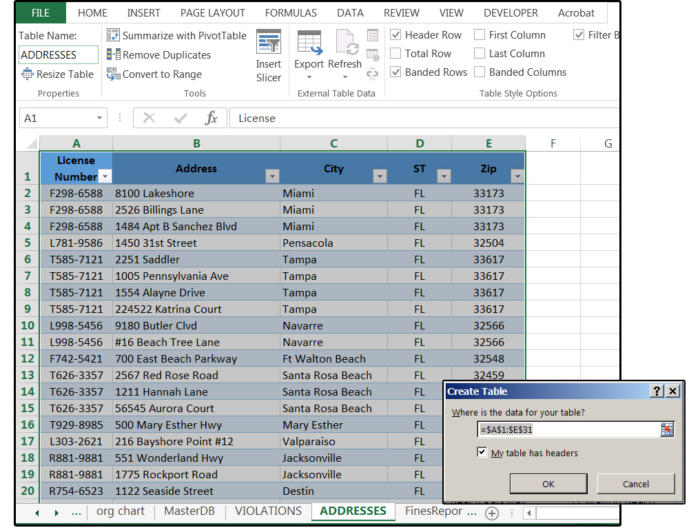
10. For the Addresses Slave table, return to the Master and copy columns C, D, E, and F (Address, City, State, Zip) to columns B, C, D, and E in the Adresses table (remember, License Number—the unique key field—is already in column A.)
11. Adjust the column widths to accommodate the data.
12. Enter around 30 records with repeated License Numbers. For example: License number F298-6588 is repeated three times. This means Roger Anderson (the driver with this license number) has three previous addresses.
13. Repeat the instructions from 5 through 9 above, this time naming the Table Addresses and defining the range as A1:E31. And that’s all there is to it.
 JD Sartain / PC World
Create the Addresses Slave Table spreadsheet